Wednesday, August 25, 2010

Recursive Hierarchy Group in SSRS 2008

In this article, I am going to explain how to create a Recursive Hierarchy Group in SSRS 2008 to display hierarchical levels. This is helpful when we want to display hierarchical data in a report e.g. employees in an organizational chart as shown below: 

Pre-requisites for this article:
  1. SQL Server 2008 along with SSRS installed
  2. Business Intelligence Development Studio (BIDS)
  3. AdventureWorksDW2008R2 database. Click here to install this database from codeplex.
  4. Familier with SSRS
Below are the stpes to create Recursive Hierarchy Group:
STEP 1: To begin, create new report in your existing solution. Add new Shared Data Source. If you don't know how to create a shared data source, click Creating Shared Data Source in SSRS 2008.

 
STEP 2: Create a new dataset for the report. Just right click on the data source and click Add Dataset... to create new data set as shown below:
In Dataset Properties window, enter dsMain in Name textbox and below T-SQL code in Query textbox:
SELECT [EmployeeKey],[ParentEmployeeKey
,[FirstName] + ' ' + ISNULL([MiddleName],'') + ' ' + [LastName] EmployeeName],[Title]
FROM [AdventureWorksDW2008R2].[dbo].[DimEmployee]
 
Finally click OK to close the window and save changes. The Report Data will look like below image:

STEP 3: Drag and drop Table control and map with dsMain dataset. Select EmployeeName in first column, Title in second column and =Level() expression in the third column. Set following properties for table control:
  • Header Background color = DarkBlue
  • Header Color = White
  • Font = Verdana, 8pt


STEP 4:  Set Group Properties to reference Recursive Parent. Select table control --> click View and check Grouping as shown below:

Open Row Group properties, click on add button and select [EmployeeKey] in Group on box.
 
Click on Advance tab of Group Properties window and select [ParentEmployeeKey] in Recursive parent box. Click OK and save changes.
 
STEP 5: We are done with report development. Click on Preview to generate the report. You can see a report like one shown below:
Here, you can see the Employee Hierarchy but not as per standard. We need to format the text to make it better report. Do below formating for EmployeeName textbox:
1) Enter below expression in FontWeight under Font Property:
=IIF(Count(Fields!EmployeeName.Value, "Details", Recursive) > 1, "Bold", "Normal")

2)  Enter below expression in LeftIndent under Indent Property:
=CStr(2 + (Level()*20)) + "pt"

Again Preview the report, report will look like below image:


Cheers!!!

Thursday, August 12, 2010

Dynamic SSIS Package to Import Excel files into SQL Server Database

Problem/Scenario
Need to import Excel files to a SQL table. Everyday one file is created at specified location in the source system. We need to copy that file from Source System to Local system and then load to SQL Table.

Conditions:
1.  Each file should be loaded only once. Everynight Job should be executed to load data into reporting Data mart.
2.  Source system will maintain all the history files so files at souce should not be deleted.
3.  If Job failed due to some reason (schema changes, server down, connection issues etc.), it should load all the files from last run date to current date in next successul run. For example, job didn't run last one week then whenever job runs next time successfully, it should load current file as well as all the files of last week which were missing.
4.  All the source files will have the same structure (Schema)
5.  Nomenclature - Each file will have name Transaction followed by current date in YYYY-MM-DD format. For example, if a file was created on 01-Aug-2010 then its name should be Transaction2010-08-01.

Solution
I will take advantage of the ForEach Loop Container. I'll create a new SSIS package to solve the above problem.

STEP 1:
Create following tables in your local database (destination database).
CREATE TABLE [TransactionHistory](
   [TransactionID] [int] NOT NULL,
   [ProductID] [int] NOT NULL,
   [ReferenceOrderID] [int] NOT NULL,
   [TransactionDate] [datetime] NOT NULL,
   [TransactionType] [nchar](1) NOT NULL,
   [Quantity] [int] NOT NULL,
   [ActualCost] [money] NOT NULL,
   CONSTRAINT [PK_TransactionHistory_TransactionID]
   PRIMARY KEY CLUSTERED ([TransactionID] ASC)
) ON [PRIMARY]
GO

CREATE TABLE [ExcelFilesLog](
   [FileName] [varchar](100),
   [FileCreatedDate] [datetime],
   [FileLoadDate] [datetime],
   [RecordCount] [int],
) ON [PRIMARY]
GO

STEP 2: Create a new SSIS package and rename it to LoadDynamicExcelFiles.dtsx

STEP 3: Add following package variables:
VariableNameDescriptionExamle
LastRunDateTo store last run date 2010-07-30
CurrentDateTo hold running date 2010-08-10
Directory
Source
To store source
directory path
D:\SSIS\Hari\SourceFiles
Directory
Destination
To store local
directory path
D:\SSIS\Hari\DestinationFiles
CurrentFile
Name
To store current
file name
D:\SSIS\Hari\SourceFiles\
Transaction2010-08-01

Create one OLE DB connection (I will use (local).TestHN connection manager) for local database where you want to load excel files data. Create one Excel Connection Manager for excel files located in D:\SSIS\Hari\DestinationFiles. At least one file should be there to create excel connection manager.

Click on Excel Connection Manager --> go to Properties window --> Select Expression and set ExcelFilePath with package variable User::CurrentFileName as shown below:

For this article, I'll use two directories - one for sources files and one for destination files. Location of these files are given below:
Source Files: D:\SSIS\Hari\SourceFiles
Destination Files: D:\SSIS\Hari\DestinationFiles

I have created few excel files from Production.TransactionHistory table of AdventureWorks2008R2 database as shown below:
I have created files from 2010-07-20 to 2010-08-01. After executing the package first time, I will create files from 2010-08-02 to 2010-08-09 to test the package.

STEP 4:
Drag and drop File System Task and double click to open File System Task Editor. Enter FST - Delete destination directory content in name and  select Delete directory content as Operation. Set IsSourcePathVariable to True and select SourceVariable as User::DirectoryDestination. Finally click on OK and save changes.

Drag and drop Execute SQL Task and double click to open Execute SQL Task Editor. Enter Execute SQL Task - Get LastRunDate in Name, select Single row as Result Set, Conection Type as OLE DB and Connection as (local).TestHN and SQLSourceType as Direct input. Enter below query in SQLStatement:
SELECT ISNULL(MAX([FileCreatedDate]),'2010-01-01') AS LastRunDate
FROM [dbo].[ExcelFilesLog] (NOLOCK)

In Result Set tab, set Result Name 0 to variable User::LastRunDate.
Finally click OK and save changes.


Drag and drop Script Task and double click to open Script Task Editor. Select User::DirectoryDestination, User::DirectorySource, User::LastRunDate in ReadOnlyVariables. Click on Edit Script... and paste below code:

using System.IO; 

public void Main()
{
   try
   {
      string DirectorySource = Dts.Variables["User::DirectorySource"].Value.ToString();
      string DirectoryDestination = Dts.Variables["User::DirectoryDestination"].Value.ToString();
      DateTime LastRunDate = (DateTime)Dts.Variables["User::LastRunDate"].Value;


      string fileName,fileExtension;
      string[] files = Directory.GetFiles(DirectorySource);
      //Copy source files to destination
      foreach (string f in files)
      {
         fileName = Path.GetFileName(f);
         fileExtension = Path.GetExtension(f);
         DateTime CurrentDate = DateTime.Parse(fileName.Substring("Transaction".Length, 10));


         if ((DateTime.Compare(CurrentDate,LastRunDate)>0) && (fileExtension == ".xlsx"))
        {
            //MessageBox.Show(fileName.ToString());
            File.Copy(f, Path.Combine(DirectoryDestination, fileName), true);
         }
      }
      Dts.TaskResult = (int)ScriptResults.Success;
   }
   catch (Exception ex)
   {
      Dts.Log(ex.Message, 0, null);
      Dts.TaskResult = (int)ScriptResults.Failure;
   }
}

Drag and drop Foreach Loop container. Select Foreach File Enumerator as Enumerator, enter D:\SSIS\Hari\DestinationFiles in Folder path and *.xlsx in files textbox. Select Fully qualified as Retrieve file name. In Variable Mappings, Select User::CurrentFileName for Index 0 to store current file name for each iteration.

Now drag and drop Data Flow Task inside Foreach loop container. Use Excel Source reader to read excel files from destination directory. Use Excel Connection Manager as connection manager for excel files. In connection properties, Select @[User::CurrentFileName] as ExcelFilePath. Use Data Conversion, if required. Use Row Count Task to count number of rows in data flow and store it in User::RecordCount variable. Use OLE DB Destination to load data into SQL table.

Drag and drop Execute SQL Task inside Foreach loop container to log information about current file.
Double click on Execute SQL Task to open Execute SQL Task Editor, enter Execute SQL Task - Insert info into Log table as Name, None as Result Set, OLE DB as connection type, (local).TestHN as connection, Direct input as SQLSourceType and below query as SQLStatement.

DECLARE
@FileName varchar(500)
,@FilePath varchar(500)
,@DestinationPath varchar(500)

SET @DestinationPath = ?
SET @FilePath = ?
SET @FileName = REPLACE(@FilePath,@DestinationPath + '\','')

INSERT INTO [ExcelFilesLog]
(
   [FileName]
   ,[FileCreatedDate]
   ,[FileLoadDate]
   ,[RecordCount]
)
SELECT
@FileName [FileName]
,CAST(SUBSTRING(@FileName,12,10) as datetime) [FileCreatedDate]
,GETDATE() [FileLoadDate]
,?

In Parameter mapping,  map User::DirectoryDestination, User::CurrentFileName, and User::RecordCount with parameter 0,1,2 respectively as shown below.
Finally click OK and save changes.

Below is the final layout of our package:

STEP 6:
We are done with the package development. To execute the package, go to SSIS package location, (in this example, it is D:\SSIS\Hari\Sample\SSIS-Sample1), right click on LoadDynamicExcelFiles.dtsx --> Open with --> SQL Server 2008 Integration Services Package Execution Utility. This will open Execute Package Utility. Click on Execute button to run ssis package. Now you can see the progress of package execution in Package Execution Progress window.

Now you can check ExcelFileLog table to cross check the result of package.

Now I'll add few more excel files in source location - from
Transaction2010-08-02 to Transaction2010-08-09 as shown below:
When I execute this package next time, it will load only new files. Yon can check ExcelFileLog for each iteration:

Saturday, August 7, 2010

Cascading Parameters in SSRS 2008

Cascading parameters provide a way of managing large amounts of report data. You can define a set of related parameters so that the list of values for one parameter depends on the value chosen in another parameter. For example, the first parameter is independent and might present a list of product categories. When the user selects a category, the second parameter is dependent on the value of the first parameter. Its values are updated with a list of subcategories within the chosen category. When the user views the report, the values for both the category and subcategory parameters are used to filter report data.

In this post we will walk through the steps of building a report and with query parameters for both product category and subcategory items. Then we will develop individual datasets to provide values for the cascading parameters.
I will use AdventureWorks2008R2 database for this article. You can install this database from codeplex.

STEP 1:
Open your existing Report Server project or create a new Report Server project. Add a new report and rename it as CascadingParameters.rdl. Now create a Data Source for AdventureWorksDW2008R2 database. For more information about creating shared Data Source, Click Creating Shared Data Source in SSRS 2008.

STEP 2:
Create three data sets as mentioned below:

1. dsProductCategory: This Data Set will be used to create a parameter for Product Categories. Use below query for this data set:
SELECT ProductCategoryID,Name AS ProductCategory
FROM Production.ProductCategory (NOLOCK)
ORDER BY Name

 2. dsProductSubcategory: This Data Set will be used to create a Cascading Parameter for Product Subcategories. Use below stored procedure for this data set.

CREATE PROC procProductSubcategory
(
   @ProductCategoryID varchar(1000)
)
AS
BEGIN
   SELECT ProductSubcategoryID,Name AS ProductSubcategory
   FROM Production.ProductSubcategory (NOLOCK)
   WHERE ProductCategoryID IN (SELECT Value
   FROM [dbo].[SplitMultivaluedString](@ProductCategoryID,','))
   ORDER BY Name
END
-------- UNIT TESTING ------------------
-- EXEC procProductSubcategory '1'
-- EXEC procProductSubcategory '1,2'
-- EXEC procProductSubcategory '1,3'
----------------------------------------
GO

Note: Function SplitMultivaluedString is used to split comma seperated values of parameter @ProductCategoryID. Click Function to Split Multi-valued Parameters to get T-SQL script of this function.

Result of EXEC procProductSubcategory '1,3' is shown below:

3. dsProduct: This data set will give the list of all the products based on the Product SubCategories selected at run time. Use below stored procedure for this data set:

CREATE PROC procProductsList
(
   @ProductSubcategoryID varchar(1000)
)
AS
BEGIN
   SET NOCOUNT ON

   SELECT
      PC.Name ProductCategory
      ,PS.Name ProductSubcategory
      ,P.Name ProductName,ProductNumber
      ,Color,Size,[Weight]
   FROM Production.Product P (NOLOCK)
   INNER JOIN Production.ProductSubcategory PS
     ON PS.ProductSubcategoryID = P.ProductSubcategoryID
   INNER JOIN Production.ProductCategory PC
      ON PC.ProductCategoryID = PS.ProductCategoryID
   WHERE P.ProductSubcategoryID IN (SELECT Value
    FROM [dbo].[SplitMultivaluedString](@ProductSubcategoryID,','))
END
-- EXEC procProductsList '6,7,8,18,30,36'
GO

Result of EXEC procProductsList '6,7,8,18,30,36' is shown below:


STEP 3:
Once you create above data sets, you can see two parameters created automatically - ProductCategoryID and ProductSubcategoryID as shown below:
Now double click on parameter ProductCategoryID to open Report Parameter Properties window. In General, change the Prompt value as Product Category and check Allow multiple values checkbox. In Available Values, Select Get values from a query option and select dsProductCategory in Dataset, ProductCategoryID in Value field and ProductCategory in Label field. Now click on Default Values, Click on Get values from a query option and select dsProductCategory in Dataset, ProductCategoryID in Value field. Finally click OK to save changes.

Similarily change the properties of parameter ProductSubcategoryID. In General, change the Prompt value as Product Subcategory and check Allow multiple values checkbox. In Available Values, Select Get values from a query option and select dsProductSubcategory in Dataset, ProductSubcategoryID in Value field and ProductSubcategory in Label field. In Default Values, Click on Get values from a query option and select dsProductSubcategory in Dataset, ProductSubcategoryID in Value field.
Finally click OK to save changes.

STEP 4:
In report Design, drag and drop a table control and map with dsProduct data set. select all the columns from dsProduct in the tables and format this as shown below:


Thats all. We are done with a report having one cascading parameter. Click on Preview to view the report. Now you can see that values of Parameter Product Subcategory depends on the parameter Product Category. By Default, Product Category parameter has (Selected All) so Product Subcategory will also display all the values.

Values of Product Subcategory parameter will be filtered as per selection of the values of Product Category parameter, which will filter the actual report data because Product Subcategory parameter is used to filter report data.

Wednesday, August 4, 2010

Function to convert a string in Camel Case (Proper Case)

Sometime, we need to display string data in proper case, i.e. first character of each word should be in UPPER case. SQL Server doesn't provide any built-in function for this requirement. In this article, I am putting T-SQL code to create this function. This is a generalised Function that will return any input string in Proper Case [Camel Case]. Means Afetr every space, first later will be in UPPER case.


Example:
Input String    :  'microSoft sql server'
Output String : 'Microsoft Sql Server'
 
/*************************************************
CREATED BY : HARI SHARMA ON MAR 30, 2007
PURPOSE : TO CONVERT INPUT STRING IN CAMEL CASE
**************************************************/
CREATE FUNCTION [dbo].[CamelCase]
(@Str varchar(8000))
RETURNS varchar(8000) AS
BEGIN
  DECLARE @Result varchar(2000)
  SET @Str = LOWER(@Str) + ' '
  SET @Result = ''
  WHILE 1=1
  BEGIN
    IF PATINDEX('% %',@Str) = 0 BREAK
    SET @Result = @Result + UPPER(Left(@Str,1))+
    SubString  (@Str,2,CharIndex(' ',@Str)-1)
    SET @Str = SubString(@Str,
      CharIndex(' ',@Str)+1,Len(@Str))
  END
  SET @Result = Left(@Result,Len(@Result))
  RETURN @Result
END
---------------------------------------------------
-- HOW TO USE --
-- SELECT dbo.CamelCase('hARi nARAyan shARMa')
-- Output: Hari Narayan Sharma
---------------------------------------------------
GO

Sunday, August 1, 2010

Creating First Cube in SSAS 2008

Nowadays, analytical solutions are becoming mission critical for many organizations. Microsoft SQL Server 2008 Analysis Services (SSAS) is designed to provide exceptional performance and scalable support with millions of records and thousands of users from different locations.

Why to Build a Cube?
There are many advantages of cube over relational data mart.
  • While querying a data mart, you can get most of the results but not everything you need for business analysis and decsion making. Cube can help you to get answers of all "What-If" scenarios.
  • Building a cube helps to house your data to centralize the business rules for calculations that you can't easily store in a relational data mart.
  • The structure of the cube makes it much easier to write queries to compare data year over year (YOY), or to create cumulative values such as year-to-date (YTD) sales.
  • Scalable Infrastructure - Analysis Services can scale to support databases of many terabytes in size with many thousands of users.
  • Superior Performance - Analysis Services cubes are multidimensional structures that enable fast access to high volumes of pre-aggregated data, empowering end users to gain insight into relevant business data at the speed of thought.
  • You gain the ability to manage aggregated data in the cube. To improve query performance in a relational data mart, we often create summary tables to prepare data for queries that don't require transaction-level detail. SSAS creates the logical equivalent of summary tables (called aggregations) and keeps them up-to-date.

I would like to introduce beginners to Microsoft SQL Server Analysis Services (SSAS) by creating a simple cube from AdventureWorksDW2008R2. You can install this database from codeplex.
I'll cover following things in this article:
  1. Creating Analysis Services Project
  2. Creating Data Source
  3. Creating Data Source View
  4. Creating Cube and Dimensions
  5. Creating Dimension Hierarchies
  6. Deploying Cube Database from BIDS
Creating Analysis Services Project.
First step is to create a project in Business Intelligence Development Studio (BIDS). Launch BIDS from Start --> All Programs --> Microsoft SQL Server 2008 --> SQL Server Business Intelligence Development Studio and then click File --> New --> Project. In the New Project dialog box, select Analysis Services Project. In the Name text box, type LearnSSAS and, if you like, change the location for your project. I'll store this project at location D:\Hari. Click OK to create the project.

 
Creating Data Source
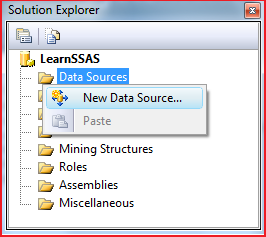
Now add a data source to define the connection string for data mart AdventureWorksDW2008R2. In Solution Explorer, right-click the Data Sources folder and click New Data Source.
In the Data Source Wizard, click Next on the Welcome to the Data Source Wizard page if it hasn't been disabled. On the Select how to define the connection page, click New to set up a new connection. In the Connection Manager, the default provider is the Native OLE DB\SQL Server Native Client 10.0, which is correct for our project.
To define the connection, type the name of your server in the Server Name text box. Alternatively you can select it from the drop-down list, then select AdventureWorksDW2008R2 in the database drop-down list and click Test Connection button to check the connection. Finally click on OK as shown below:
 
When you're back in the Data Source Wizard, click Next. On the Impersonation Information page, select Use the service account option so that service account will be used to read data from the source when loading data into your SSAS database and service account  must have read permissions to do so. Click Next and then Finish to complete the wizard.
 
Creating Data Source View
Now next step is to create a data source view (DSV) from the data source to define dimensions and cubes. You can make changes to the DSV without modifying the actual data source, which is very useful if you have only read permissions to the data mart. In Solution Explorer, right-click on the Data Source Views folder and then click New Data Source Views...You can see Data Source View Wizard. Click Next on the Welcome page. On the Select a Data Source page, select the data source just added to the project (Adventure Works DW2008R2.ds) and click Next. Now add required objects to the DSV by double-clicking each table or view on Select Tables and Views page. I want to add the following tables to the DSV to make it easy to understand for beginners:
DimDate, DimProduct, DimProductCategory, DimProductSubcategory, and FactInternetSales. You can always add more tables later if you want to explore advance BI questions. Now click Next in the Data Source View Wizard once you are finished adding required tables followed by click on Finish. You can give a name to your DSV before clicking Finish button.
I would recommend you to change the name of objects by selecting each one in the DSV designer and remove the Dim and Fact prefixes from the FriendlyName property because when you create dimensions and cubes, only FriendlyName property will be assigned to the objects.
The DSV is shown below:
 
Creating Cube and Dimensions
Next step is to create a Cube and Dimensions from the data source view. In Solution Explorer, right-click on the Cubes folder and then click New Cube...You can see Cube Wizard. Click on Next in Welcome to the Cube Wizard page.On the Select Creation Method page, keep the default option Use existing tables and click Next button. On the Select Measure Group Tables page, choose InternetSales table and click Next.
Now the wizard displays all the measures available in the selected measure group tables. Measures are basically numeric values e.g. OrderQuantity, Unit Price, Sales Amount, Tax Amount etc. Select only the following measures from Internet Sales Group: Order Quantity, Unit Price, Total Product Cost, Sales Amount, and Internet Sales Count
Now click on Next button to open Select New Dimensions page and select Date and Product dimensions. Click Next to proceed.
In the Completing the Wizard page, enter the cube name as AdventureWorksCube and click Finish button to complete the wizard. Cube layout is shown below:
Now click on each dimensions and add required attributes from the Data Source View.
Date Dimension:
Drag and drop FullDateAlternateKey, CalendarYear, CalendarQuarter, EnglishMonthName, and EnglishDayNameOfWeek. Rename FullDateAlternateKey with Full Date, EnglishMonthName with Calendar Month, and EnglishDayNameOfWeek with Calendar Week as shown below:

Product Dimension:
Drag and drop EnglishProductCategoryName from ProductCategory table, EnglishProductSubcategoryName from ProductSubcategory table and Color, ModelName, Size and Weight from Product table.

Creating Dimension Hierarchies
Navigate to Date Dimension Structure. Drag and drop Calendar Year attribute into Hierarchies surface area following by Calendar Quarter, Calendar Month, Calendar Week , and Full Date attributes.
Rename hierarchy with Calendar. You'll see a warning mark in the hierarchy because attribute relationship is not set properly.

Set Attribute Relationships
Click on the Attribute Relationships tab in the dimension designer. This tab is available only in Analysis Services 2008. By default, all attributes relate directly to the key attribute, Date Key as shown below:
To optimize the design by reassigning relationships, Right Click on Full Date and select New Attribute Relationship. Select Related Attribute as Calendar Week and Relationship type as Rigid (will not change over time). Repeat same thing for remaining attributes. Finally Attribute Relation will look like below image:

Deploying Cube Database from BIDS
Now its time to deploy the cube at required server. Right click on the project (LearnSSAS in this example) and click properties to open project properties page. Enter Server Name name Server property and Database name in Database property as shown below:
Click OK to save changes. Now right click on the project and click on Process to Build and Deploy the project. You will a message while deploying the database first time.
Click on Yes to proceed. Now you can see Process Database - PreojectName window. Click on Run to continue.

Once the database is deployed and processed successfully, you can see the data through Browser tab or directly through SQL Server Analysis Services. You can also pull cube data in Excel using Excel OLAP Pivot Tables, which is the prefered option used by business managers.